Project
Creating a Grower Analytics Platform
Built PlantPulse, a customer-facing dashboard that made day-to-day crop changes visible, reliable, and fast for greenhouse growers.
Background and Goal
Leaficient sells greenhouse analytics to commercial growers. The goal isn’t “more data”—it’s a faster feedback loop. If we can show, with evidence, how the crop responded today vs yesterday, growers can adjust lighting, irrigation, and HVAC before small drift turns into harvest loss.
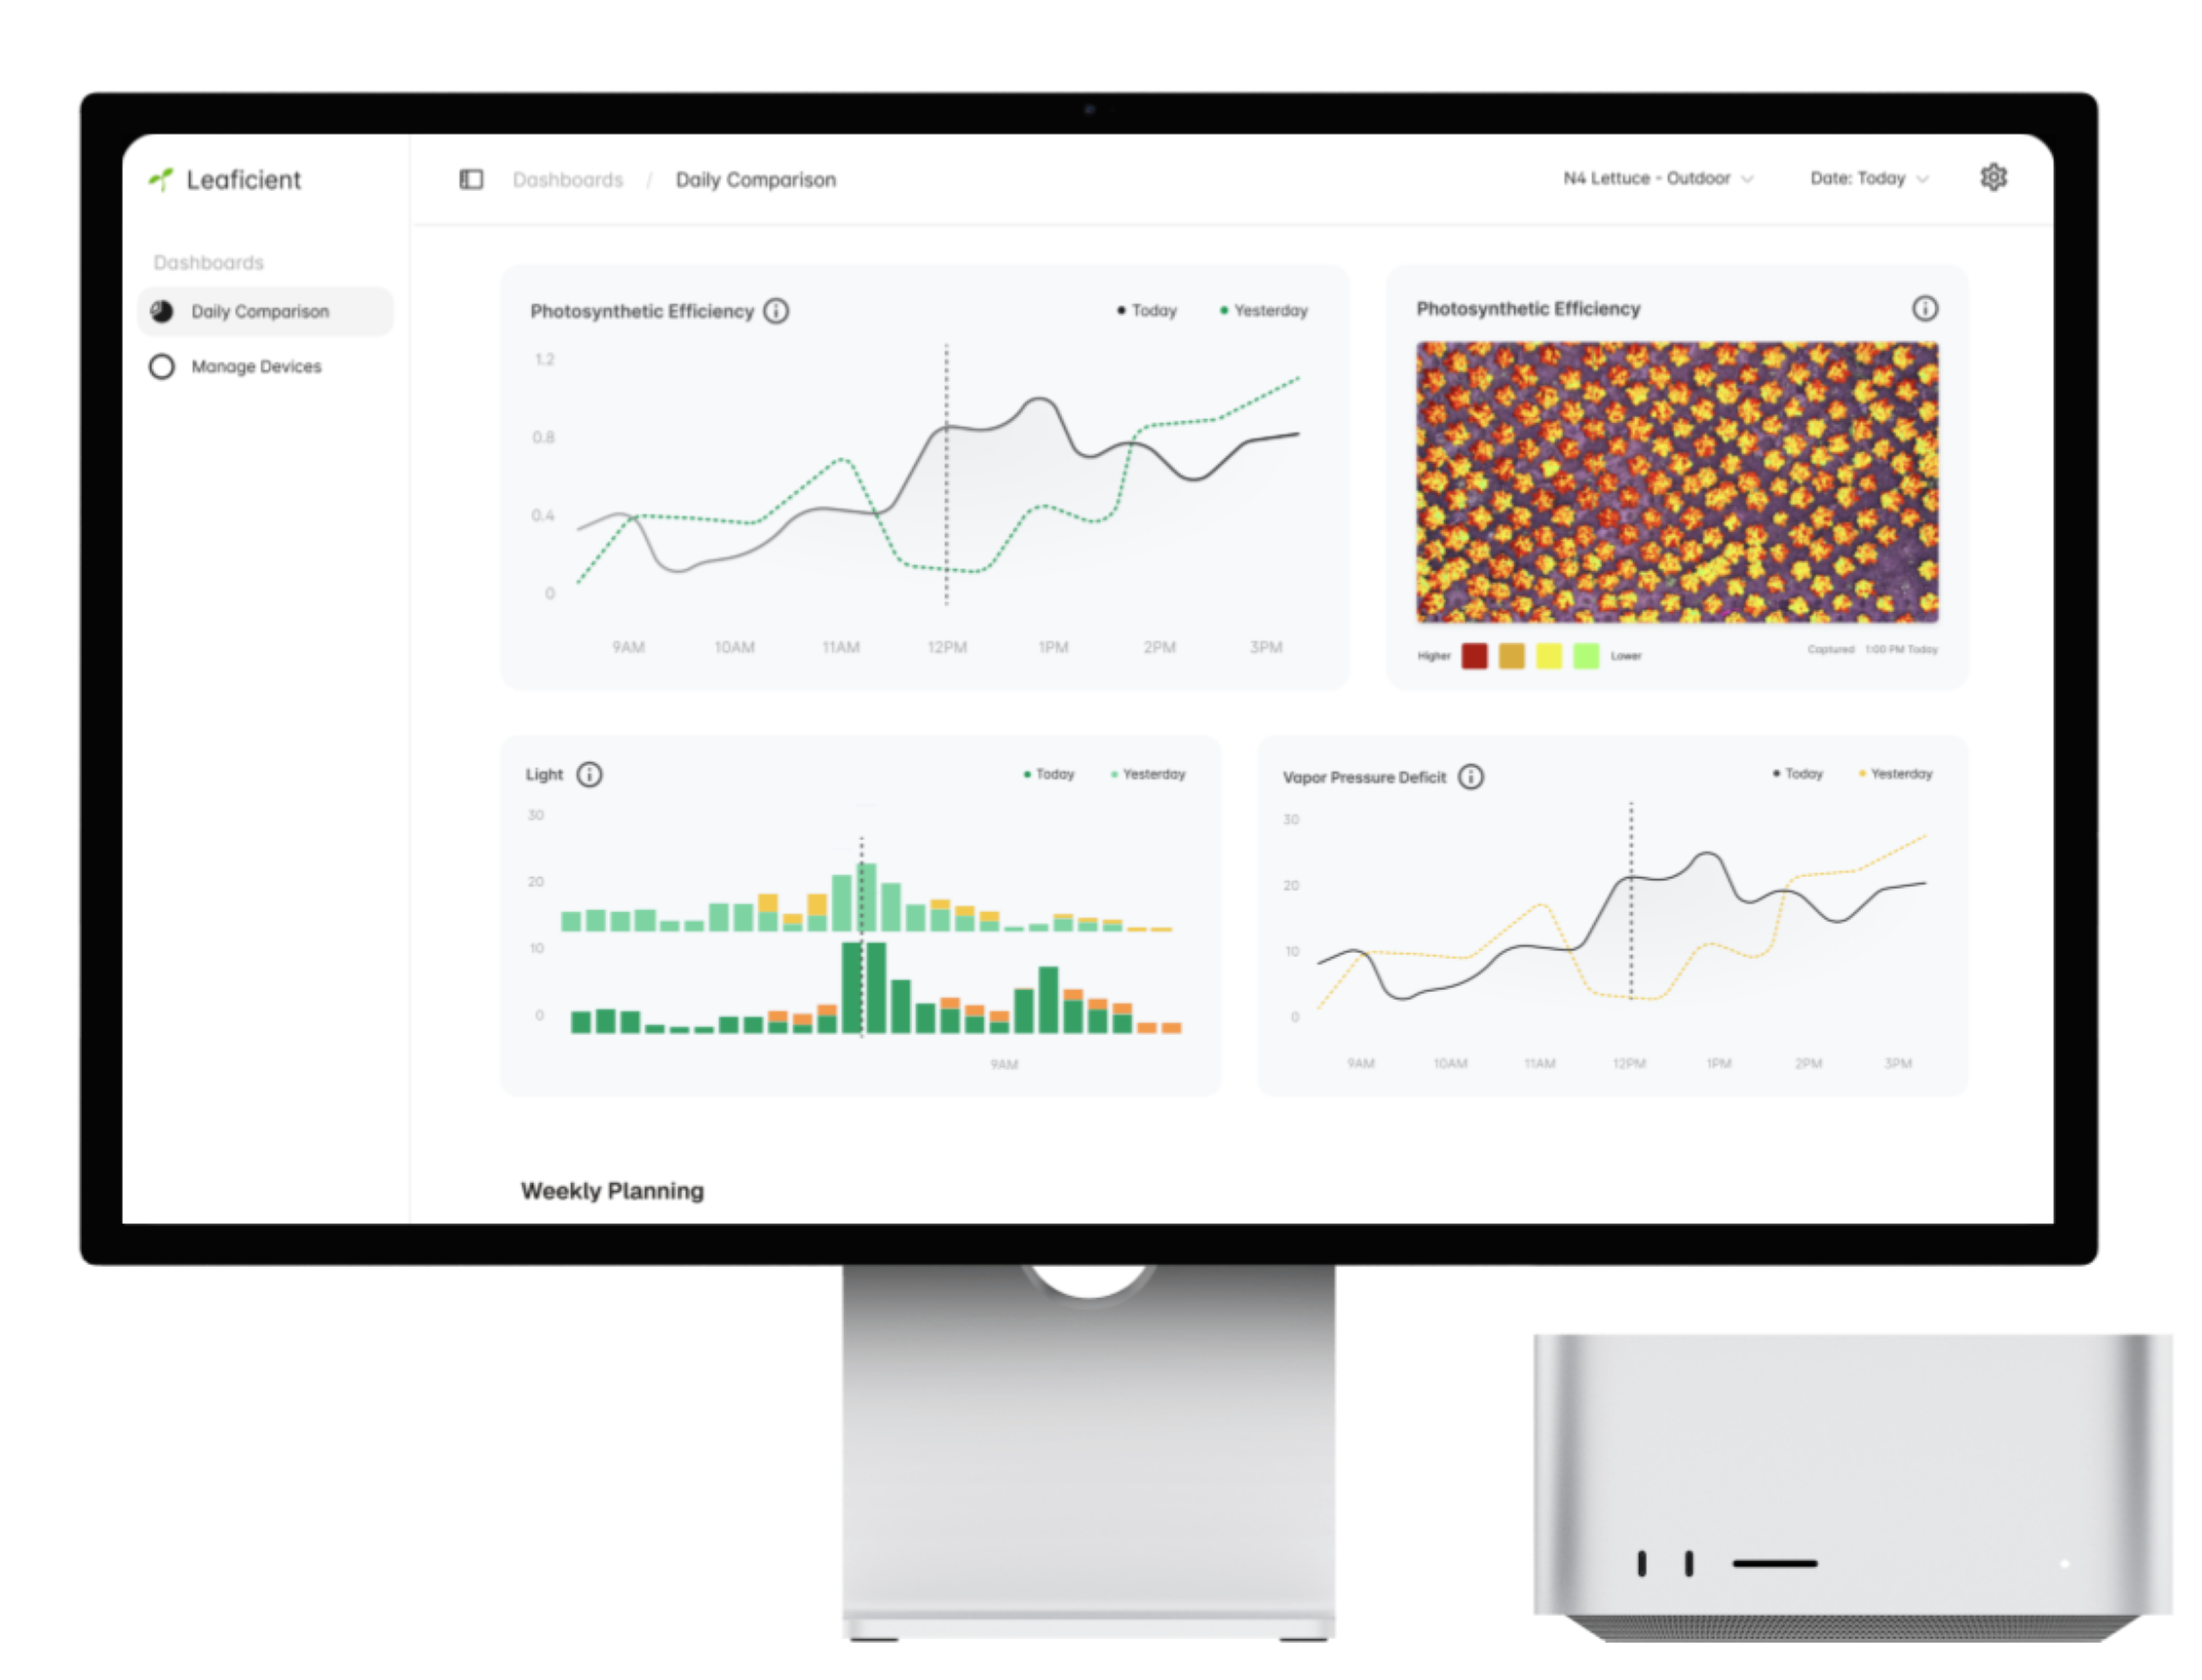
That’s why PlantPulse defaults to two consecutive-day lines and pairs them with light + environmental comparisons: it makes cause-and-effect visible at the pace growers actually operate.
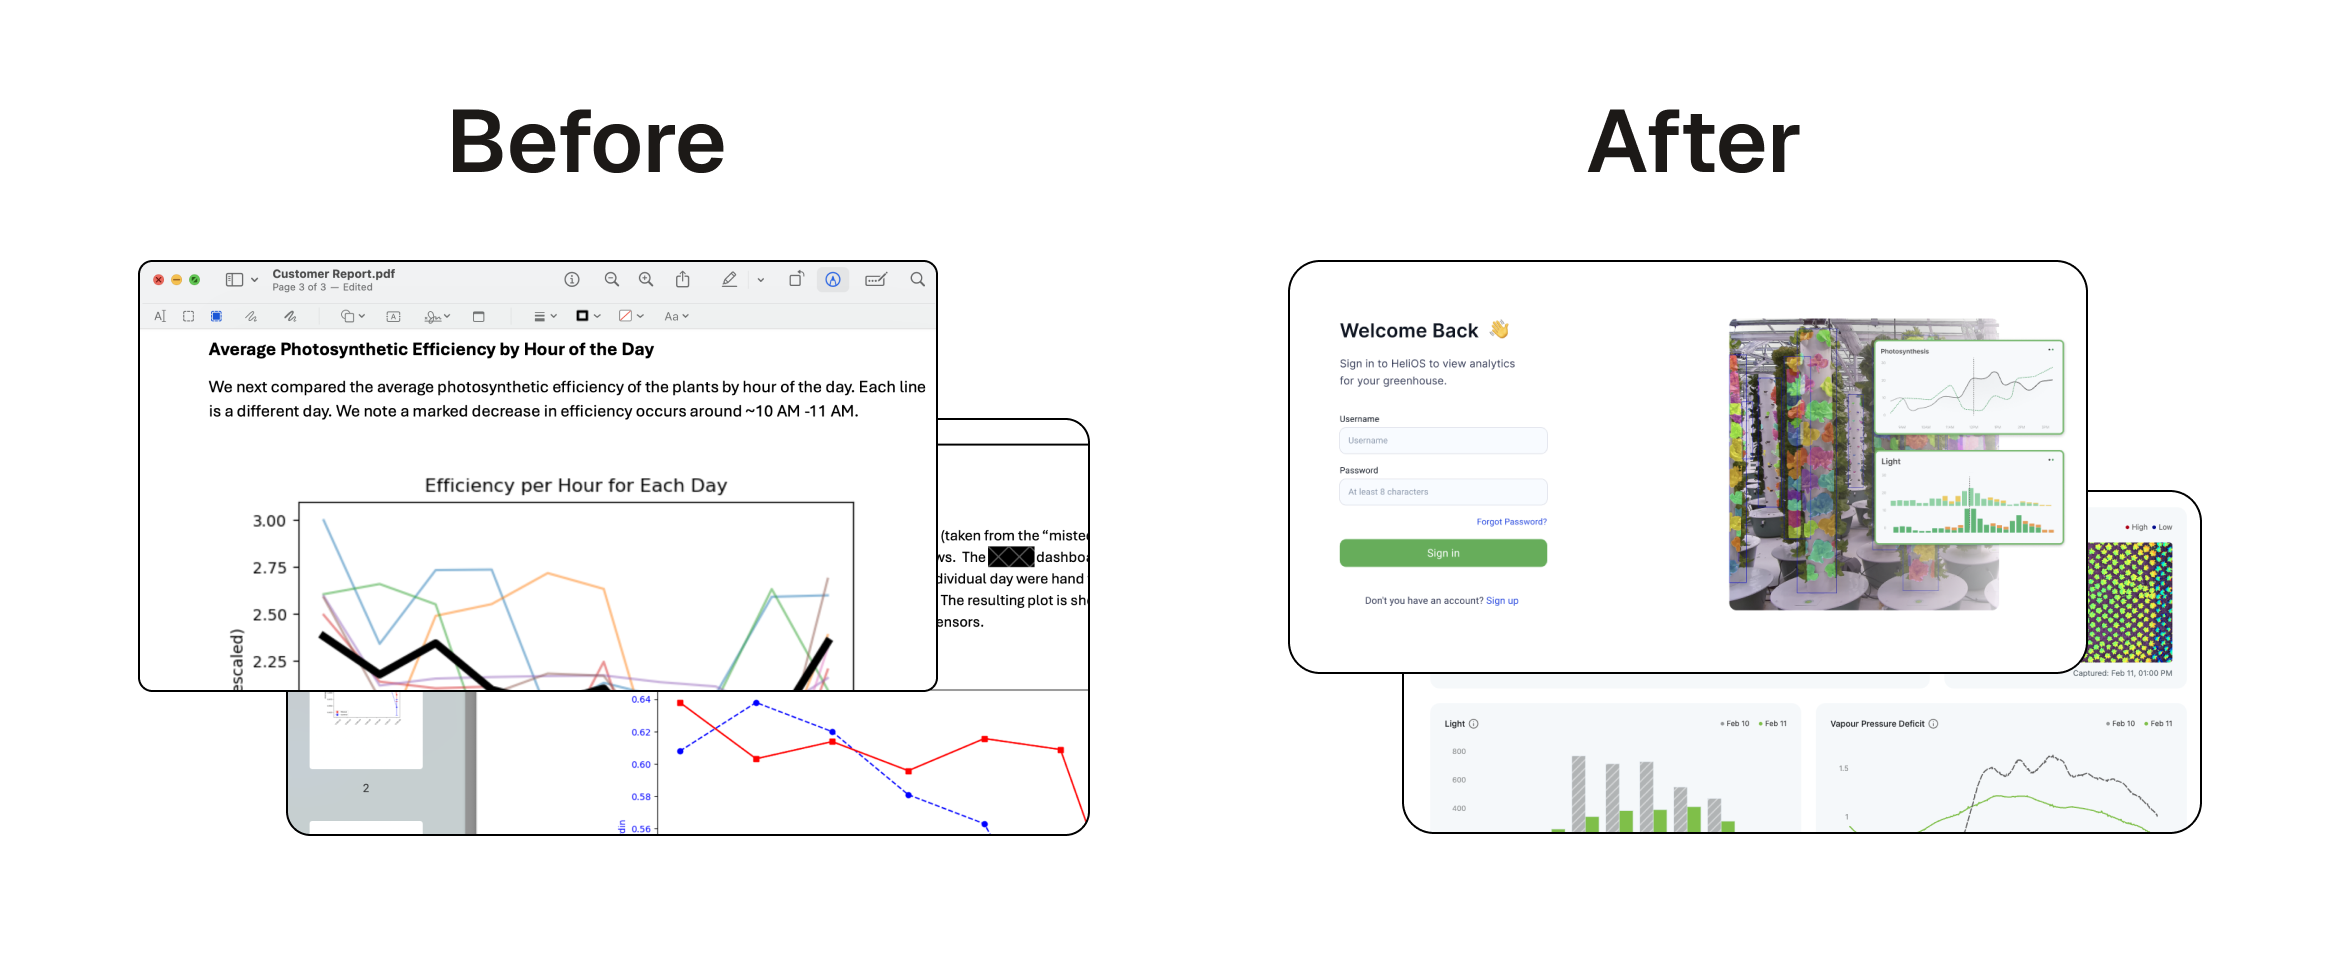
When I joined, we were running analytics in production for two greenhouses, but deployments to new facilities didn’t hold up. The blocker wasn’t model capability—it was packaging: customers didn’t have a reliable, self-serve way to interpret the outputs, compare days, and trust what they were seeing.
“What changed in my greenhouse today vs yesterday?”
The Problem
We had strong building blocks—image-derived plant signals, stress scoring, early forecasting—but customers couldn’t see the story those systems were telling.
Three issues blocked rollout:
- Access: Growers didn’t have a place to explore their own data. Answers required manual queries and hand-built charts.
- Workflow mismatch: Growers operate in short, operational windows (today vs yesterday, after a lighting change, last 48 hours). Static reporting didn’t fit.
- Scaling trust: Every greenhouse had different sensors, layouts, and naming. Inconsistency in presentation created doubt, even when analytics were correct.
This wasn’t “just UI.” It was product reliability: if the interface isn’t fast, consistent, and evidence-backed, the analytics won’t become something growers use day-to-day.
What I Led
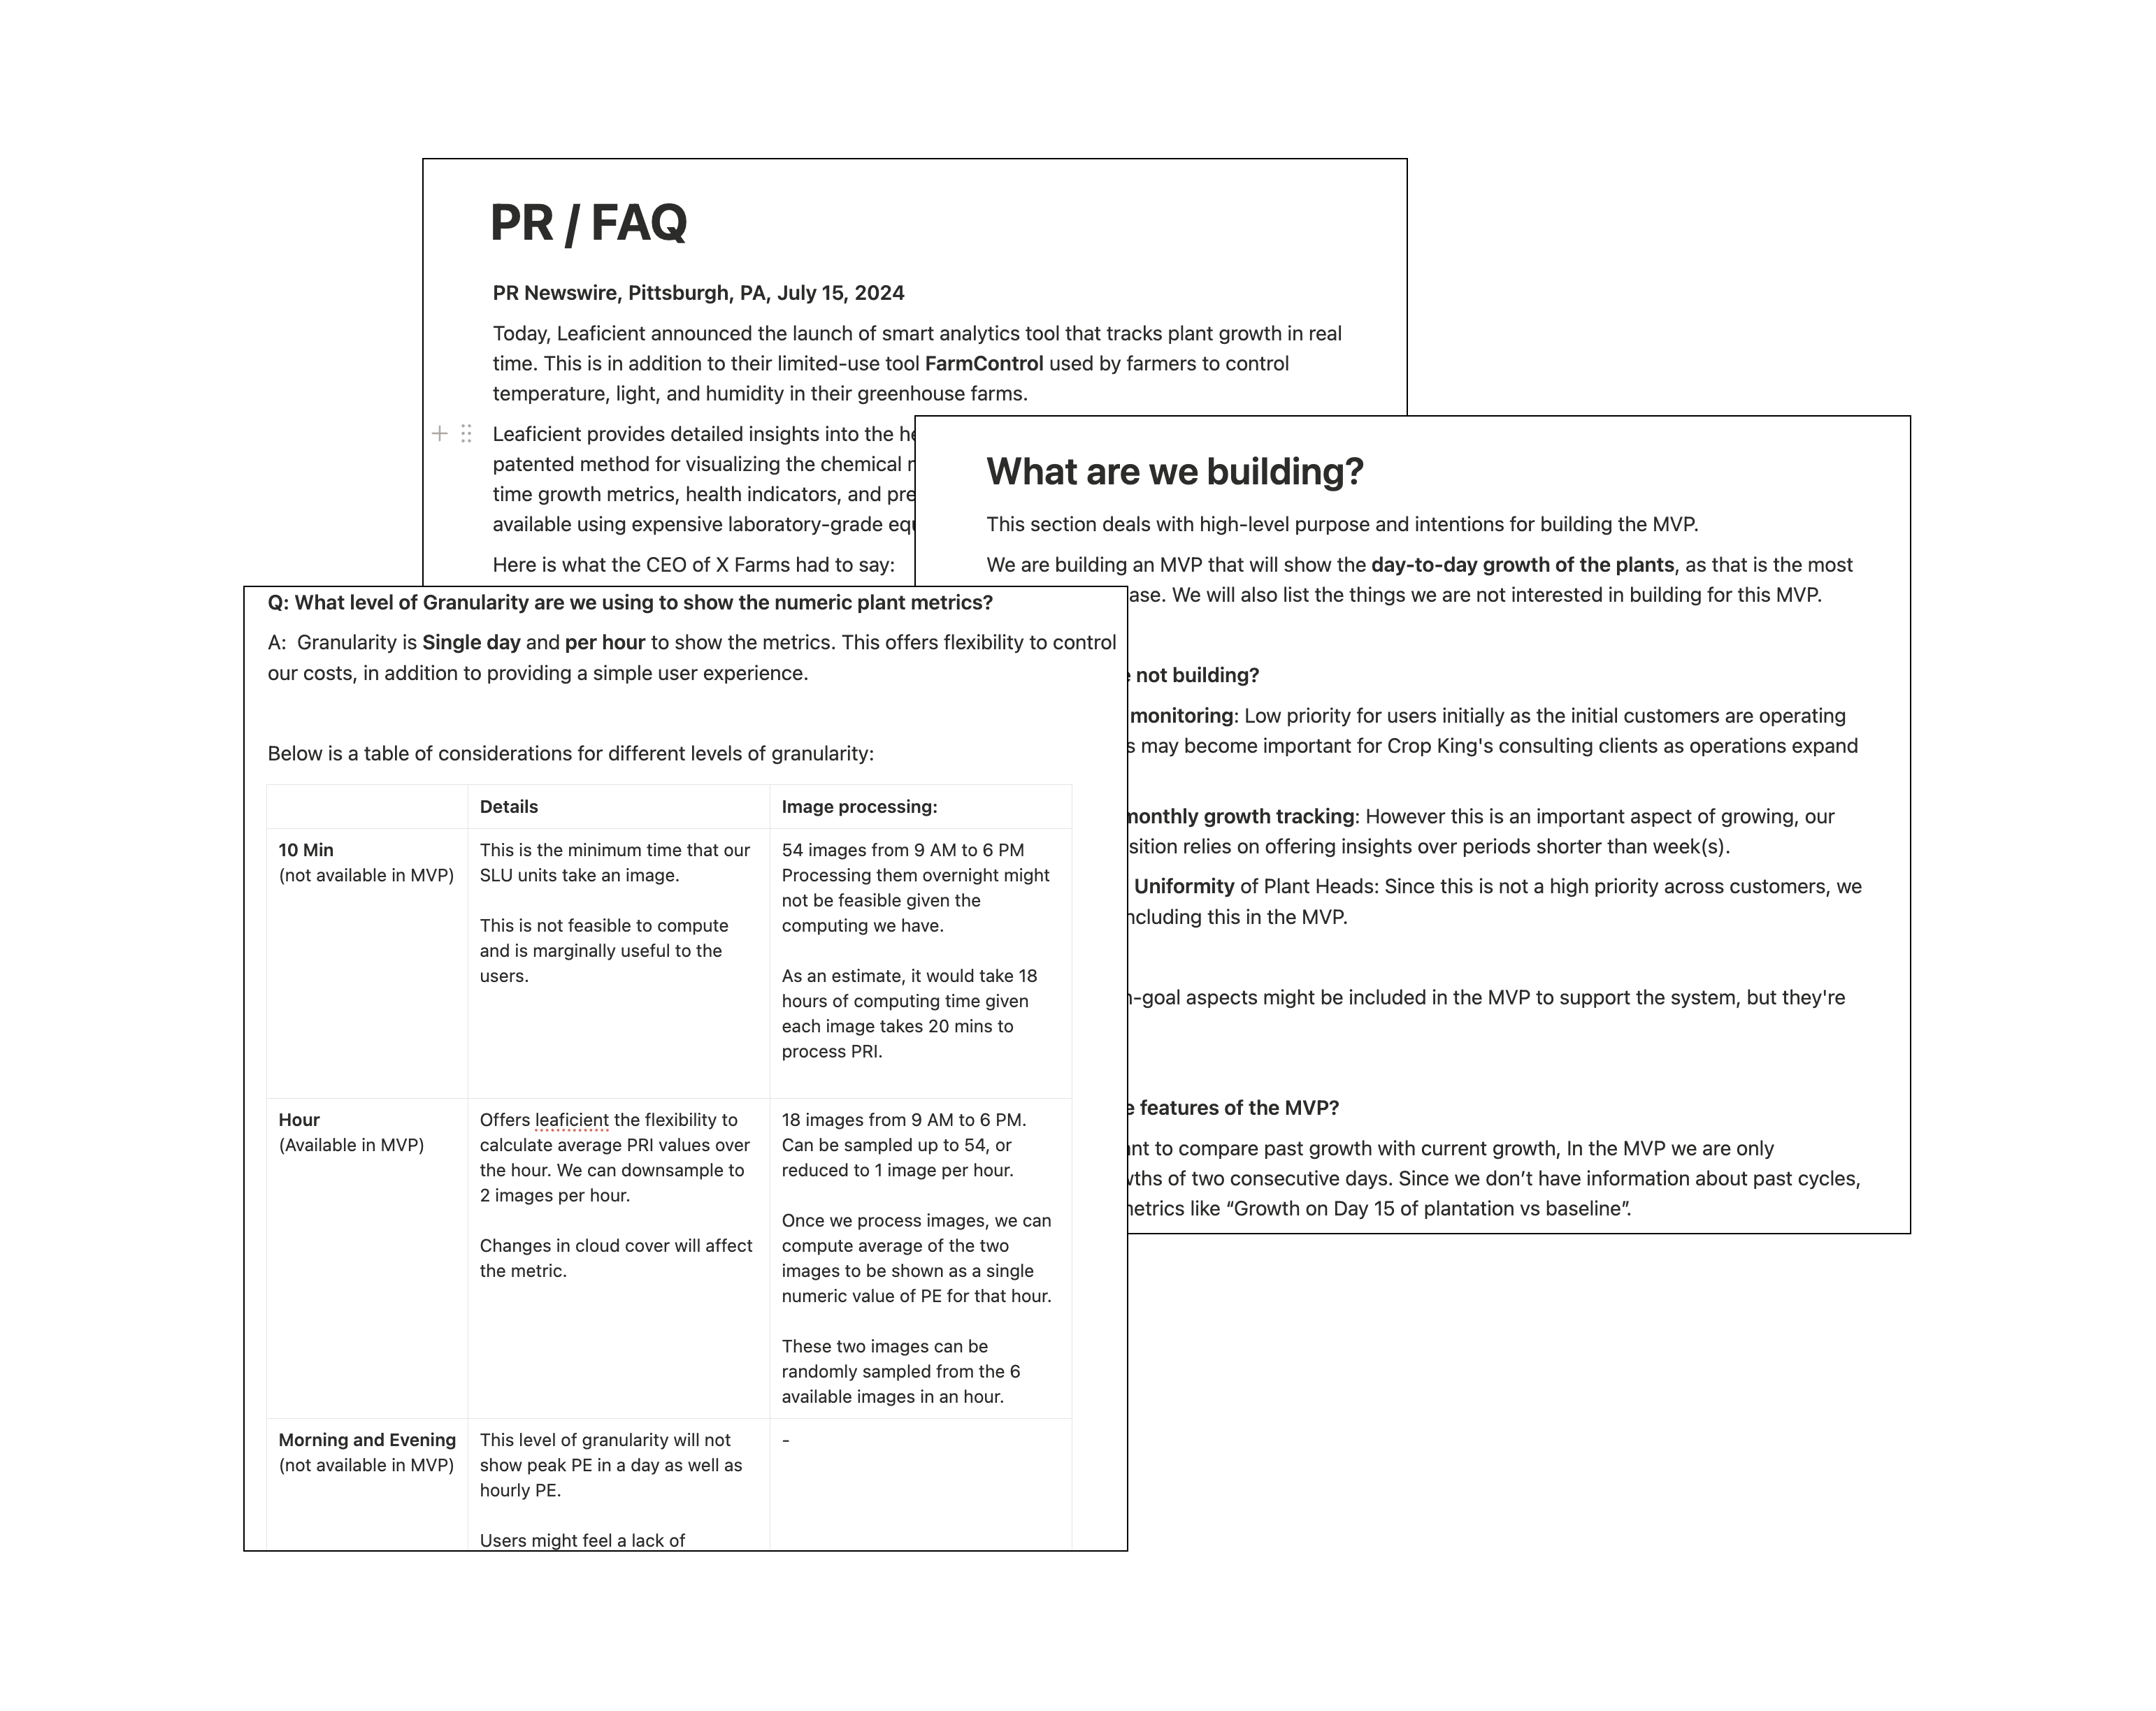
Alignment: I wrote the PlantPulse PR/FAQ
Before building, we needed shared clarity on scope, constraints, and what not to do.
I wrote and led the PlantPulse PR/FAQ and used it as the decision document in design reviews and weekly planning. It locked the MVP around daily comparisons, the customers driving urgency, and the constraints that mattered (ship speed, compute cost, onboarding across camera units).
Key decisions captured in the PR/FAQ:
- MVP focus: day-to-day growth signals with a default today vs yesterday comparison (we didn’t yet have consistent multi-week baselines everywhere).
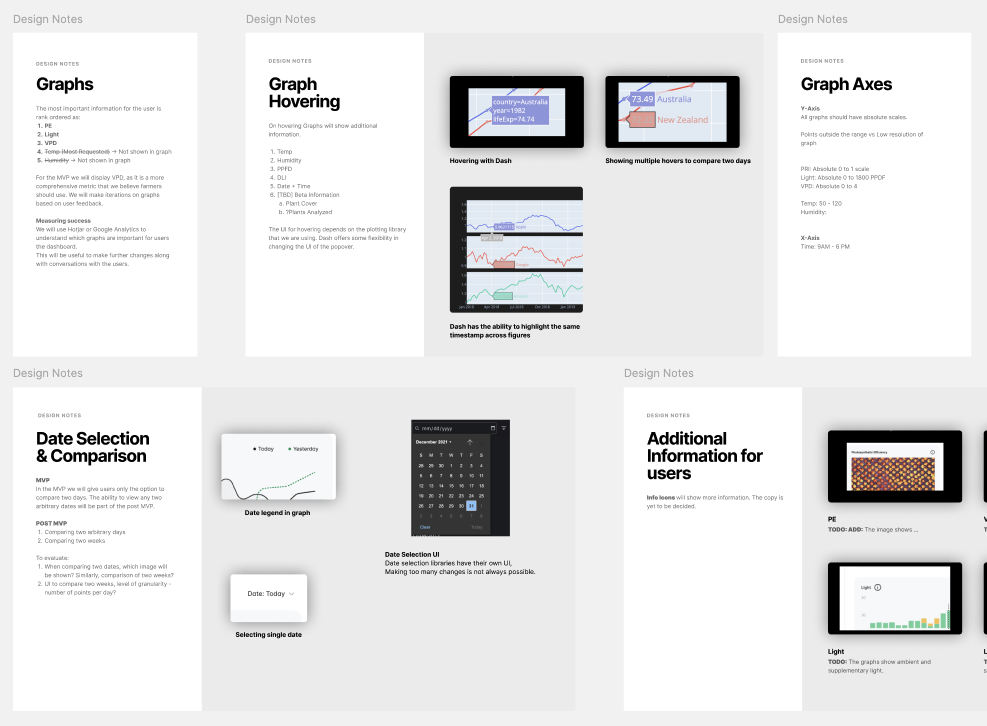
- Naming + clarity: we used simplified, operational language (e.g., Photosynthetic Efficiency) so growers didn’t need to learn internal model terms.
- Granularity: hourly trend + daily snapshot to balance usefulness with compute cost.
- Image strategy: one representative midday image (~1 PM) per day with layers (Raw / PE / IR) so each day is grounded in a consistent visual reference across different deployments—without building a full temporal image stack in the MVP.
- Dashboard vs email: we chose a dashboard over a daily email because it supports exploration, faster iteration, and live updates on refresh.
Speed over theory: ship the MVP, demo it, iterate
Shipping fast was the priority. Instead of waiting on interview scheduling and debating the solution space, I reviewed the feedback we’d already collected from growers (repeated questions, confusing terms, and what they needed to compare day-to-day).
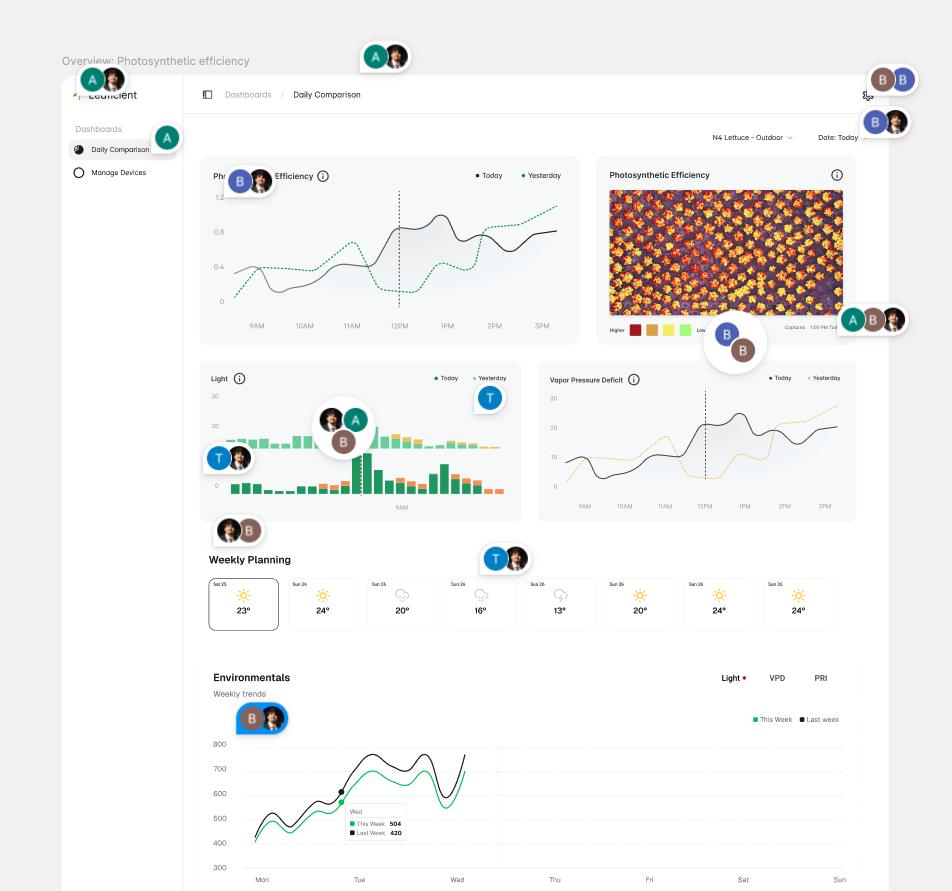
Then I designed the MVP in Figma, ran quick internal design reviews, shipped the dashboard, and put it in front of customers.
The loop:
- ship the MVP in days, not weeks
- demo it live to customers
- ask them to use it as part of their daily routine
- collect feedback from real usage (not hypotheticals)
- iterate quickly
It sounds counterintuitive, but it was faster and more accurate: we got concrete reactions to a real page.
Dashboard Information Architecture
This is the lightweight information architecture I used in design reviews: one page, one context, one comparison, one decision loop. It mirrors the final 2×2 dashboard grid.
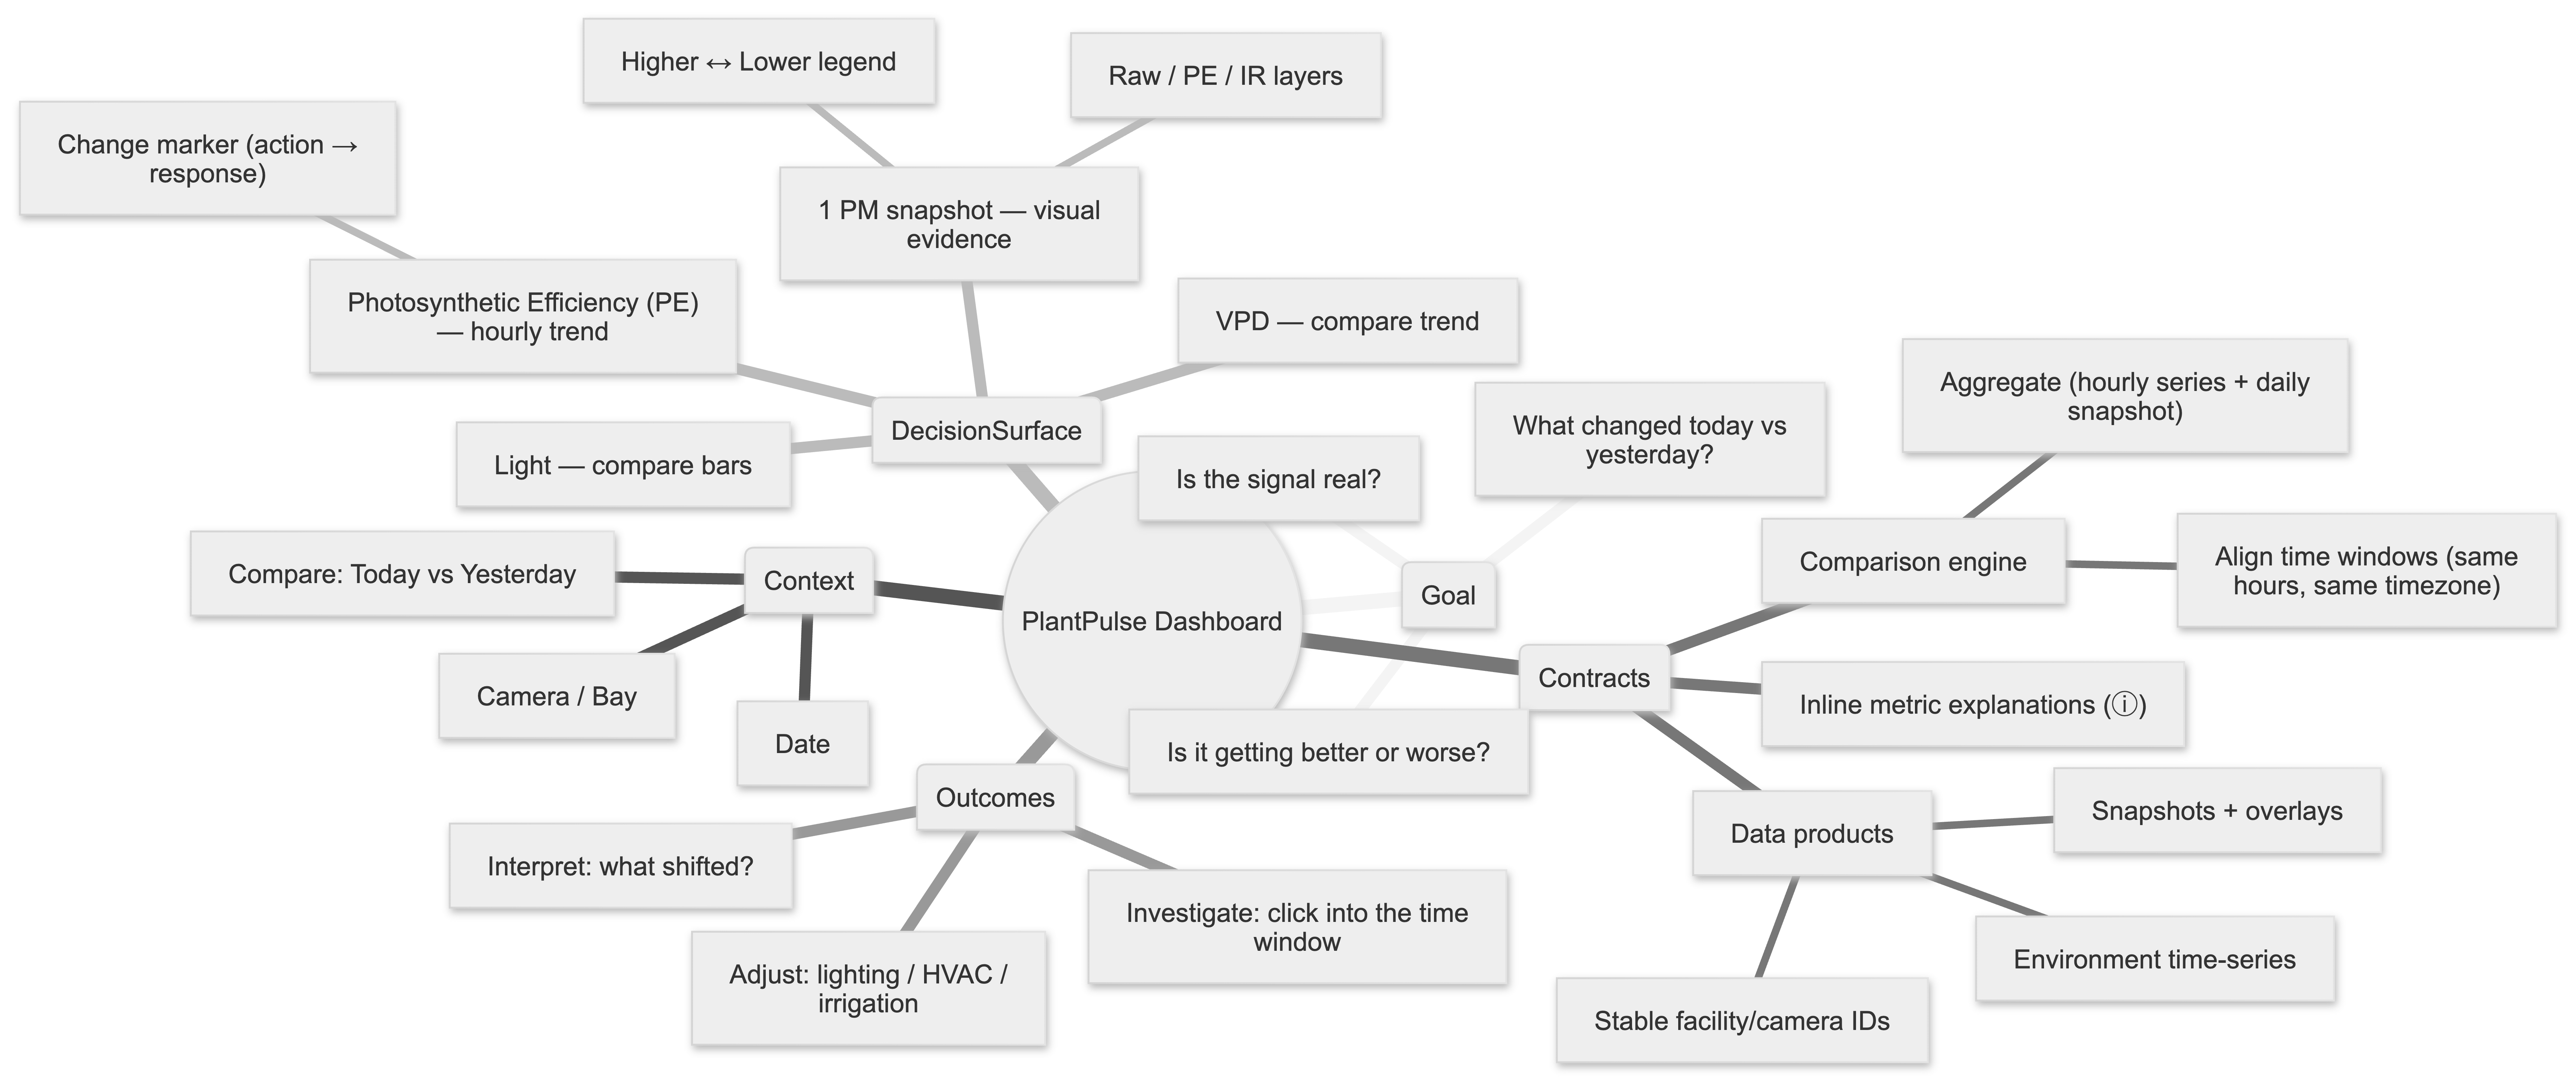
Key Decisions
Decision 1: Build the MVP in Plotly Dash
Speed was the top priority, and our analytics tooling already lived in Python: model outputs, comparison logic, and plotting utilities. Dash let us reuse that existing library directly—same language, same functions, same graph tooling—so we could iterate daily without rebuilding the visualization layer.
A React/Vue dashboard would’ve introduced a second stack (frontend state + charting + build/deploy + duplicated chart logic), plus additional glue to expose every metric cleanly through APIs.
For the same MVP scope:
- React/Vue: 4+ weeks to reach a stable, polished daily-compare experience
- Dash: 1–2 weeks (which is what we shipped)
Dash wasn’t a forever UI decision. It was the most defensible MVP call to maximize reuse and minimize integration overhead when getting to production quickly mattered most.
Decision 2: Design the data contract around the UI
Growers don’t request “rows.” They request:
- “today vs yesterday for this camera”
- “what changed around 1 PM”
- “show the image that matches the spike”
I defined the response shapes the UI needed (pre-aggregated, filterable, consistent identifiers) so the page stayed fast and predictable across facilities.
Decision 3: Treat performance as a feature
If it’s slow, growers won’t use it. From the start we optimized for:
- fast initial load (summaries / pre-aggregation)
- predictable drill-downs (bounded queries)
- image browsing that doesn’t lock the page (lightweight assets and lazy loading)
From MVP to Final UI
Most of the final layout was locked in after we shipped the MVP and watched growers use it.
What changed through real usage + feedback:
- We made “today vs yesterday” unavoidable. Two consecutive-day lines stayed visible without extra configuration.
- We collapsed everything into a single 2×2 grid. Growers wanted one scan-friendly page.
- We added the change marker. Demos kept circling around “when we changed something.” The marker made the chart match the conversation.
- We kept evidence lightweight but consistent. The ~1 PM snapshot (with simple layering) grounded each day without building a temporal stack.
- We enforced time alignment across PE, Light, and VPD. Cross-checking only works when the hours line up.
- We shipped with inline explanations. Tooltips reduced support pings and made onboarding smoother.
Systems Integration
This dashboard became the front door to multiple streams:
- Sensor time series (climate/environment)
- Image-derived plant signals (segmentation → growth/health metrics)
- Model outputs (stress indicators and early yield visibility)
The product rule was consistency: one timeline, one set of filters, one way to compare days. That consistency made the system debuggable too—when something looked off, the dashboard helped triangulate what happened using time-aligned charts and image evidence.
Results
- Adoption: PlantPulse became the primary interface customers used to review crop performance and compare consecutive days.
- Speed to value: The Dash MVP shipped in ~1–2 weeks and created a tight feedback loop for customer iteration.
- Trust: Pairing day-to-day metrics with a consistent visual snapshot reduced doubt and improved interpretation across different deployments.
- Operational reliability: When model behavior needed review, I routed top failure images to Weights & Biases to accelerate triage during training cycles.
Key Takeaway
Leaficient already had analytics in production, but the product couldn’t scale past a couple facilities because insights weren’t accessible, consistent, or fast enough for day-to-day decisions. By leading PlantPulse end-to-end—PR/FAQ alignment, Figma design, Dash implementation, and rapid customer iteration—we turned “data in databases” into a workflow growers could rely on.